Analytics Dashboard: Track Your Lead Generation Performance
 Jared
Jared
Table of Contents
- What is the Analytics Dashboard?
- Key Metrics Explained
- Interactive Charts
- Time Range Filters
- Scraping History
- How to Access
- FAQ
What is the Analytics Dashboard?
The PinLeads Analytics Dashboard is a comprehensive performance tracking tool that gives you complete visibility into your lead generation activity. See exactly how your scrapes are performing, which searches yield the best results, and track your efficiency over time.
What you can track:
- Total leads generated and scraping jobs completed
- Average leads per scrape and leads per minute efficiency
- Email and website discovery rates
- Top performing searches
- Daily trends and historical patterns
- Complete scraping history with status tracking
Everything is visualized with interactive charts and graphs, so you can quickly identify what's working and optimize your strategy.
Key Metrics Explained
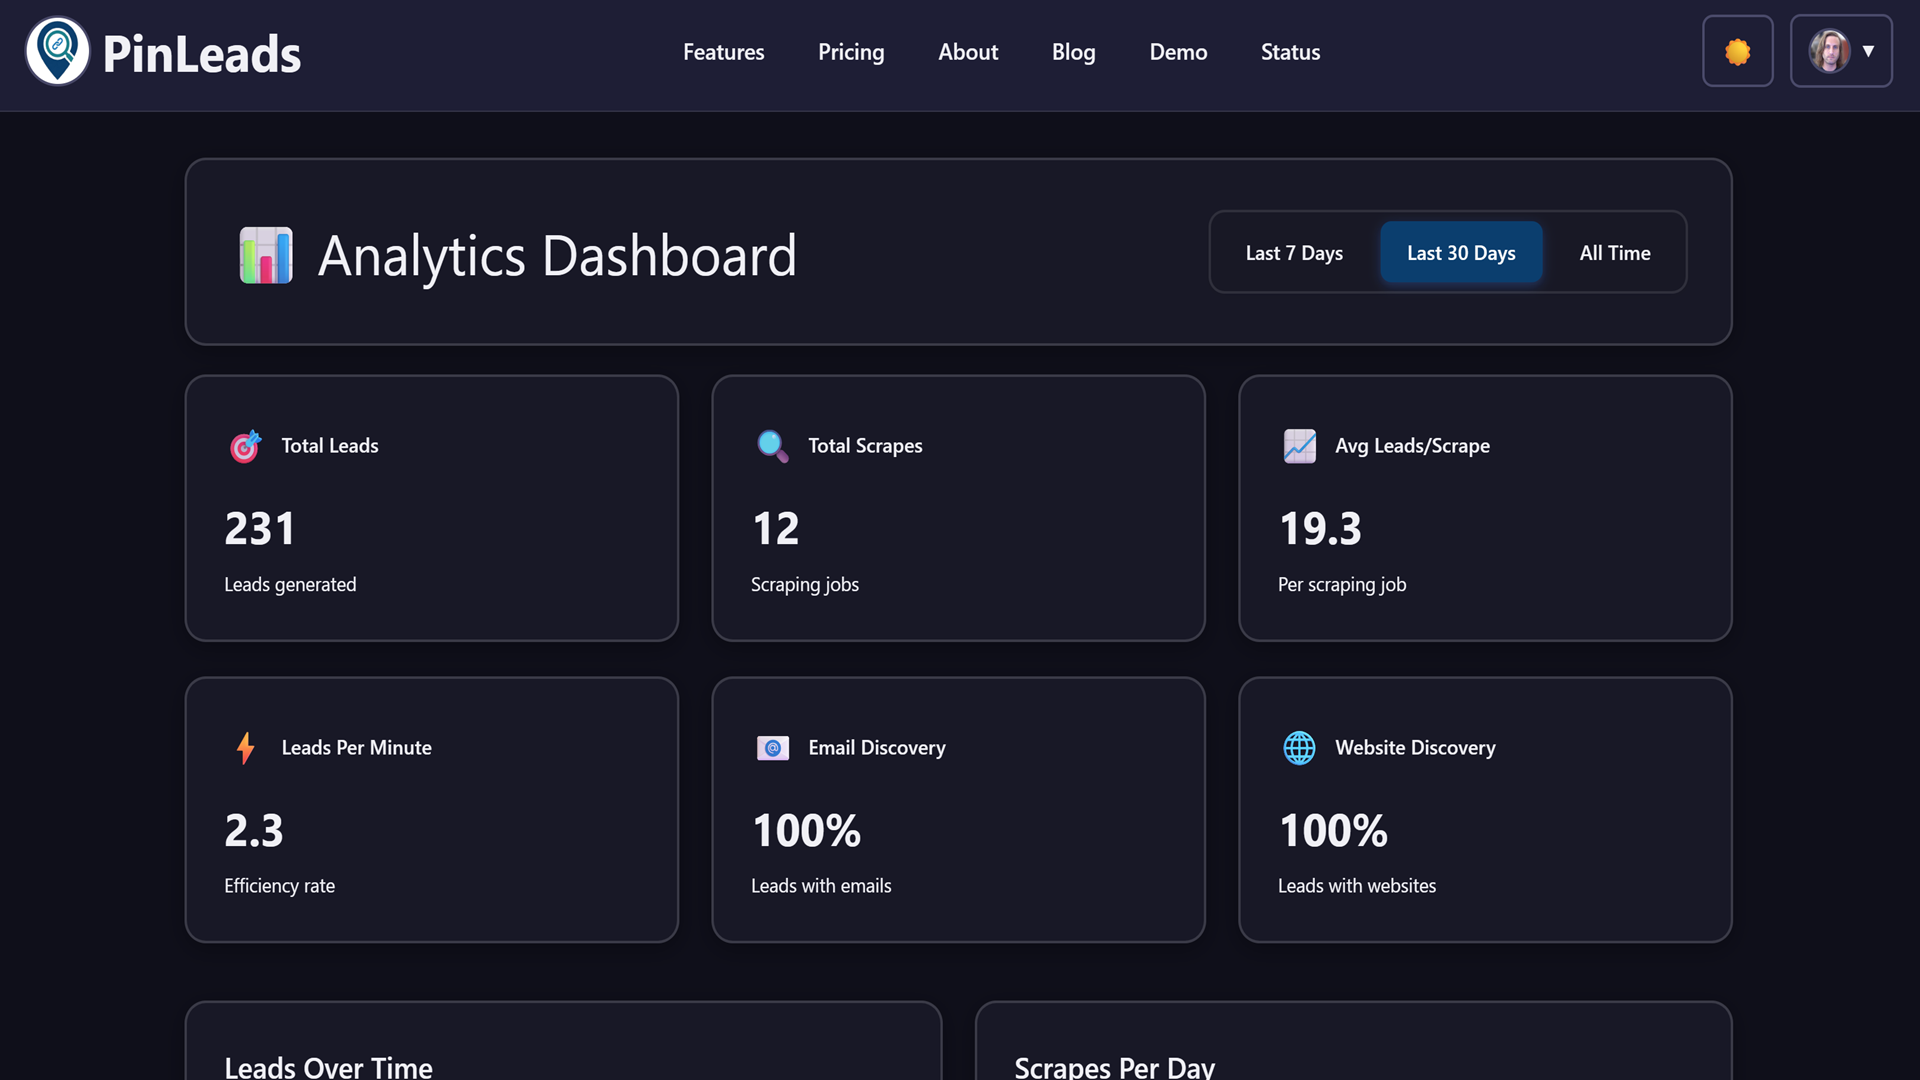
Total Leads
The total number of leads you've extracted across all scraping jobs. This includes all business data (names, emails, phones, websites, addresses) regardless of whether they have contact information.
Total Scrapes
The number of scraping jobs you've completed. This helps you understand your scraping frequency and can be useful for calculating averages.
Avg Leads/Scrape
The average number of leads extracted per scraping job. This metric helps you understand the efficiency of your searches. Higher numbers indicate more productive search terms or locations.
Benchmark: A good average is 10-20 leads per scrape for local business searches. If you're consistently below 5, consider refining your search terms or expanding your geographic area.
Leads Per Minute
How many leads you're extracting per minute of scraping time. This measures the speed and efficiency of the scraping process. Higher numbers mean faster data extraction.
Benchmark: 5-10 leads per minute is typical for directory extraction. Anything above 10 is excellent.
Email Discovery Rate
The percentage of leads that include an email address. Email addresses are the most valuable piece of contact information, so this metric directly impacts your outreach potential.
Benchmark: 30-50% is typical for local businesses. Industries like contractors and service businesses tend to have higher email rates than retail or food service.
Website Discovery Rate
The percentage of leads that include a website. Websites are valuable for research, verification, and alternative contact methods.
Benchmark: 60-80% is typical for online directory business listings.
Interactive Charts
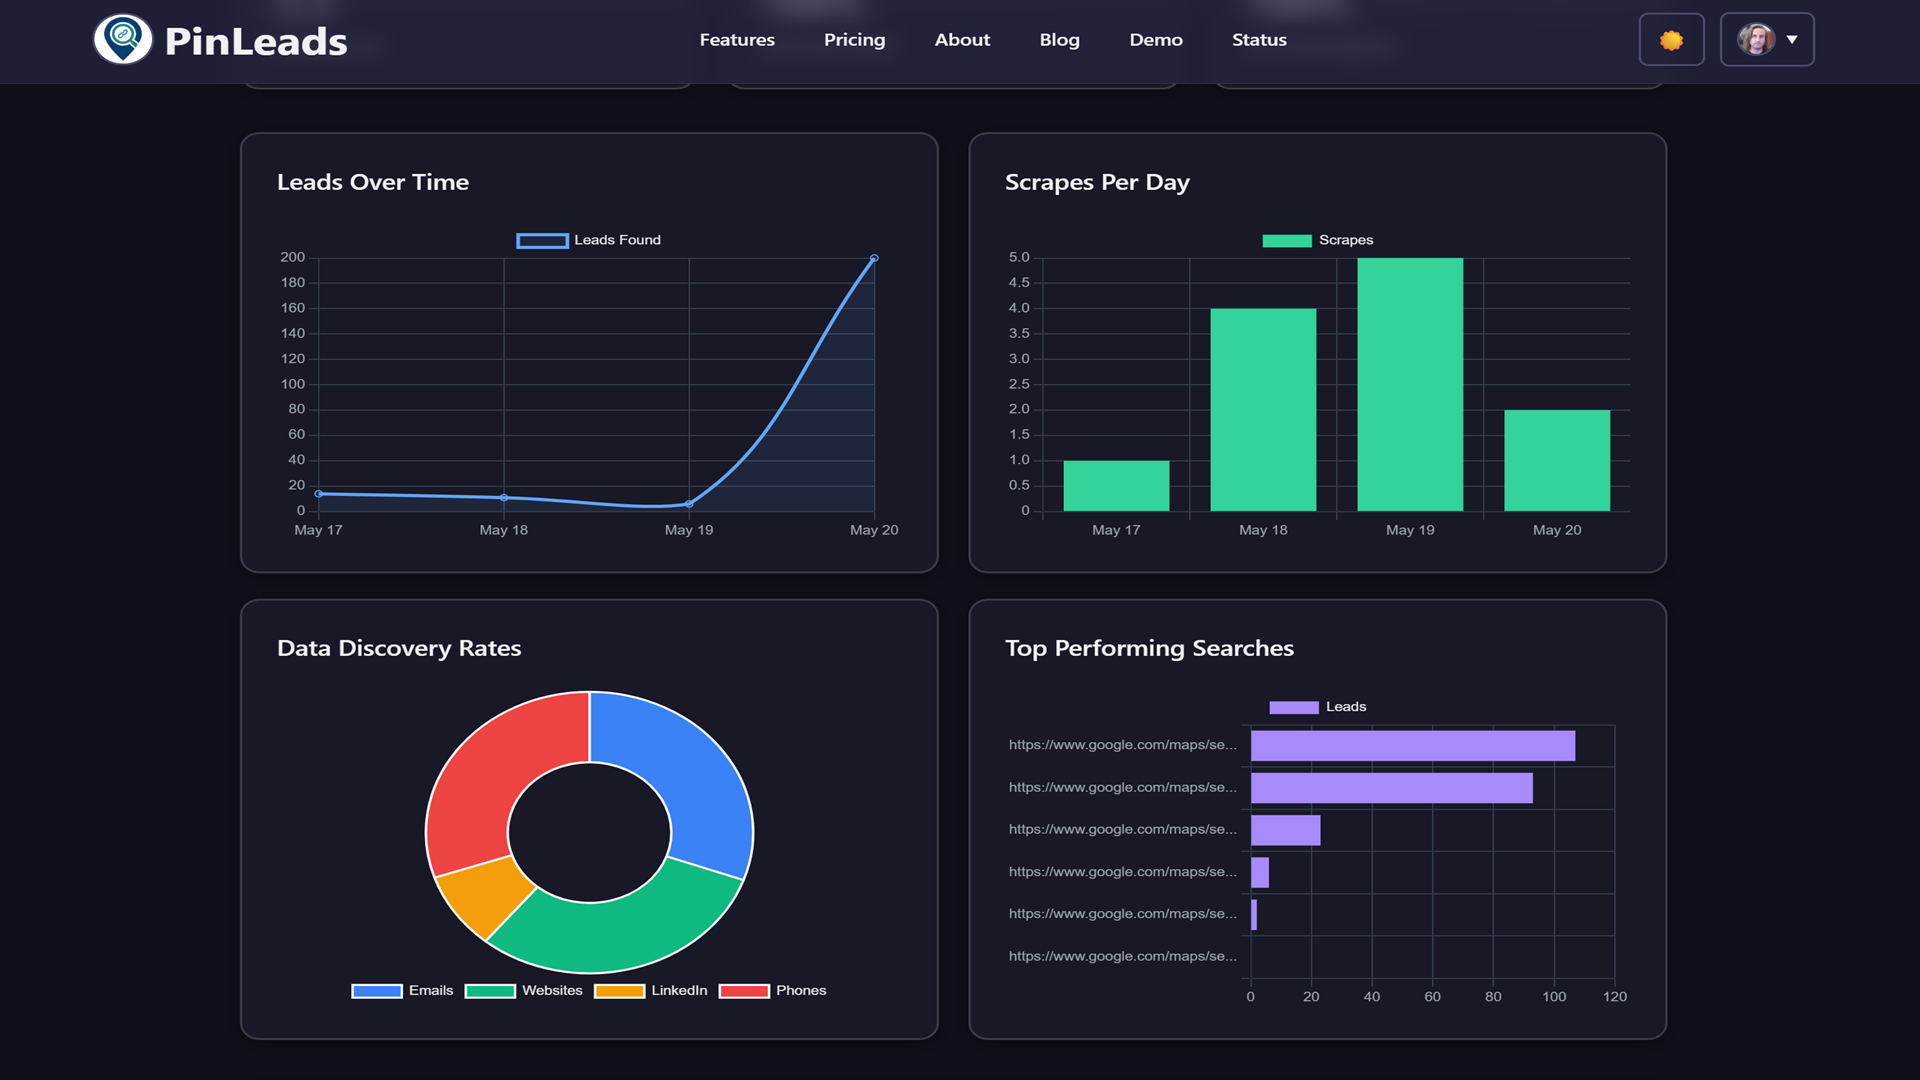
Leads Over Time
A line chart showing your lead extraction trends over your selected time range. This helps you visualize patterns and identify peak performance periods.
Use cases:
- See if you're generating more leads over time
- Identify seasonal patterns in your target markets
- Track the impact of strategy changes
Scrapes Per Day
A bar chart showing how many scraping jobs you run each day. This helps you understand your scraping frequency and can reveal patterns in your workflow.
Use cases:
- Identify your most productive days
- Plan your scraping schedule
- Track consistency in your lead generation efforts
Data Discovery Rates
A doughnut chart showing the breakdown of data types you're extracting (emails, websites, LinkedIn profiles, phone numbers). This helps you understand the quality of your leads.
Use cases:
- See which data points are most abundant
- Adjust outreach strategy based on available data
- Identify opportunities to improve data quality
Top Performing Searches
A horizontal bar chart showing which search queries or URLs are yielding the most leads. This helps you double down on what's working.
Use cases:
- Identify your highest-yielding search terms
- Prioritize locations or industries
- Replicate successful searches in new markets
Time Range Filters
The dashboard lets you filter your data by time range:
- Last 7 Days: Recent performance for quick insights
- Last 30 Days: Monthly view for tracking progress
- All Time: Complete historical analysis
Switch between ranges to see how your performance changes over time. This is especially useful for:
- Comparing recent performance to historical averages
- Tracking the impact of new strategies
- Identifying long-term trends
Scraping History
The dashboard includes a complete history of all your scraping jobs with detailed information for each:
| Field | Description |
|---|---|
| Date | When the scrape was completed |
| Type | Single search or multi-scrape batch |
| Leads | Number of leads extracted |
| Duration | How long the scrape took |
| Leads/Min | Efficiency metric for that job |
| Status | Completed or failed |
You can paginate through your history to review past jobs. This is useful for:
- Reviewing failed scrapes and troubleshooting
- Comparing performance across different searches
- Tracking your scraping activity over time
How to Access
Step 1: Check Your Plan
The Analytics Dashboard is available for:
- Pro Plan: Starting at $9.99/month
- Business Plan: Starting at $29.99/month
- Free Plan: Not available
Upgrade from the pricing page if you're on the free plan.
Step 2: Navigate to Analytics
Once you're on Pro or Business, access the dashboard from:
- Direct URL: pinleads.org/analytics
- Account page: Click "View Analytics" button
- Main navigation: Analytics link in the menu
Step 3: Start Tracking
The dashboard automatically tracks all your scraping activity. No setup required — just start scraping and the data will appear immediately.
FAQ
Is my data private?
Yes. Your analytics data is only visible to you. We don't share your scraping statistics with anyone else.
How far back does the history go?
Analytics tracks all scraping activity from when you first started using PinLeads. There's no time limit on historical data.
Can I export my analytics data?
Currently, analytics data is view-only within the dashboard. We plan to add CSV export functionality in a future update.
Does the dashboard track Chrome Extension scrapes?
Yes. All scraping methods — web app, Chrome Extension, and API — are tracked in the analytics dashboard.
What happens if I downgrade to the free plan?
Your historical analytics data remains accessible as long as you had a Pro or Business plan at the time the data was collected. However, you won't see new data if you downgrade.
Can I see analytics for specific searches?
Currently, you can see top performing searches in the charts section, but you can't filter the entire dashboard by a specific search. This feature may be added in the future.
How often is the data updated?
Analytics data updates in real-time. As soon as a scrape completes, the metrics and charts reflect the new data.
Does this impact my scraping limits?
No. The analytics dashboard is purely for viewing and doesn't consume any of your scraping quota or time limits.
Getting Started
Ready to take control of your lead generation data?
- Upgrade to Pro or Business if you're on the free plan
- Navigate to Analytics Dashboard
- Select your preferred time range
- Review your metrics and identify opportunities
- Optimize your strategy based on the data
The dashboard is available immediately after upgrading. No setup required — your historical data is already there waiting for you.
Free Tools to Help You
Cold Email Subject Line Generator
Generate personalized, high-converting subject lines with predicted open rates.
Try Tool →Email Deliverability Checker
Analyze your emails for spam triggers and get deliverability scores.
Try Tool →Lead List ROI Calculator
Calculate the ROI of your lead generation campaigns with visual reports.
Try Tool →Related Articles
How to Find Roofing Leads Using Google Maps in 2026 (Complete Guide)
Discover how to find high-quality roofing contractor leads using directory extraction. Step-by-step tutorial with templates, CSV examples, and proven outreach strategies for B2B sales.

How Web Designers Find Local Business Clients with Directory Extraction
Learn the exact workflow successful web designers use to find local businesses with outdated websites, extract contact info, and pitch redesign services that convert.

How to Extract Leads from Google Maps Without Coding (2026 Tutorial)
Complete no-code guide to extracting leads from Google Maps. Extract names, phones, emails, and websites without writing Python code.
Directory Extractor with CSV Export: Complete Integration Guide
Learn why CSV export is critical for directory extractors and how to integrate scraped local business data into your sales pipeline and CRM systems.

Lead Generation for Commercial Cleaning Companies Using Google Maps
How commercial cleaning businesses can stop relying on referrals and start actively finding facility managers, property managers, and corporate clients using Google Maps extraction.

Why Apollo.io Fails for Google Maps Lead Gen (Better Alternative)
Apollo.io is built for enterprise SaaS sales, not businesses on Google Maps. Learn why Google Maps extraction is superior for finding plumbers, roofers, dentists, and service providers.